Taming the Ralph Part 3: In Practice
After running an AI coding agent overnight, here are the actual performance numbers. 81% improvement in layout shift, 65% fewer long tasks, and what metrics actually matter.

In Part 1, we built the loop. In Part 2, we learned how to control it. Now, after running the agent overnight, let’s talk numbers.
The metrics that matter
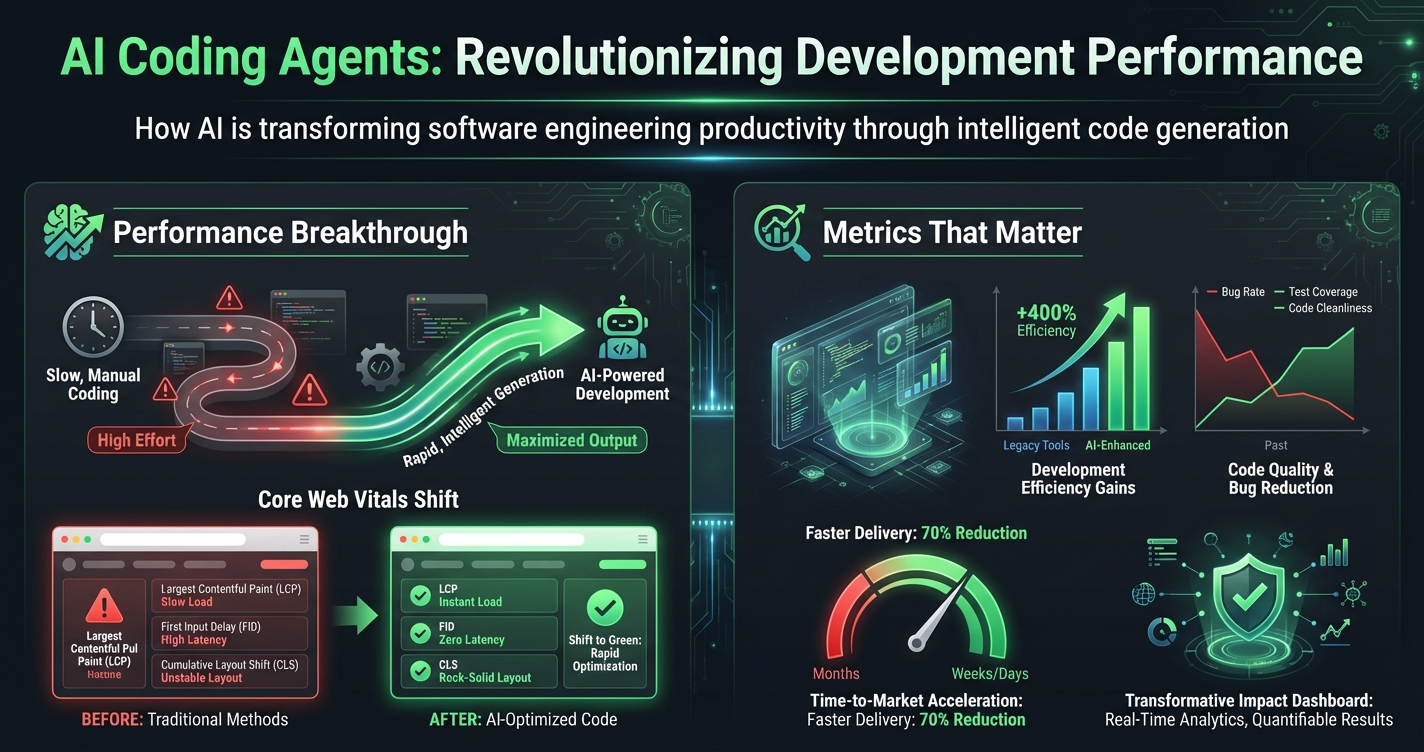
Before diving into results, you need to know what you’re measuring. We focused on three Core Web Vitals metrics:
Cumulative Layout Shift (CLS) - How much does the page jump around as it loads? Google considers under 0.1 “good.” Anything over 0.25 is poor.
Long Tasks - JavaScript executions over 50ms that block the main thread. More long tasks = more jank.
Click Response Time - How long between a user’s tap and something happening? Under 250ms feels instant. Over 400ms feels broken.
Day one results
After the first full day of autonomous optimization, here’s where we landed:
| Metric | Before | After | Change |
|---|---|---|---|
| Dashboard Long Tasks | 19 | 8 | -58% |
| Scroll Long Tasks | 20 | 7 | -65% |
| Chat Long Tasks | 7 | 2 | -71% |
| Click Response | 378ms | 242ms | -36% |
Long Tasks dropped by 65% during scroll. That’s the difference between smooth and janky.
The 36% improvement in click response time is something users actually perceive. Breaking under 250ms crosses a psychological threshold—interactions start to feel instant rather than sluggish.
The layout shift breakthrough
Day two brought an unexpected win. After fixing a subtle issue with how images loaded, layout shift numbers collapsed:
| Metric | Before | After | Change |
|---|---|---|---|
| Dashboard Load CLS | 0.242 | 0.046 | -81% |
| Scroll CLS | 0.253 | 0.055 | -78% |
Layout shift improved by 81%.
Both metrics crossed under Google’s 0.1 “good” threshold. Users won’t consciously notice this—they’ll just stop feeling that subtle wrongness when things shift under their fingers.
What the agent actually changed
Across two days of running, the agent made targeted changes to roughly a dozen components:
- Optimized rendering strategies - Components now skip unnecessary updates
- Improved list performance - Large lists render more efficiently during scroll
- Fixed image loading patterns - Reserved space for images before they load
- Reduced JavaScript execution time - Moved expensive calculations out of the render path
Each change was small. The cumulative effect was significant.
The compound effect
Here’s what surprised us: individual optimizations looked underwhelming. A 10% improvement here, 15% there. But performance gains compound.
When you reduce long tasks on the dashboard by 58%, users scroll faster. When they scroll faster, they trigger more list renders. When those renders are 65% more efficient, the whole experience transforms.
You can’t optimize your way to good performance with one change. But a dozen targeted improvements add up to something users feel.
What the numbers don’t show
Metrics tell part of the story. Here’s what they miss:
Perceived smoothness - The app feels different now. Same features, same design, but interactions have a crispness that wasn’t there before.
Battery impact - Fewer long tasks means less CPU work, which means better battery life on mobile devices. We haven’t measured this formally, but the phone runs cooler.
Developer confidence - Having automated performance testing means we catch regressions early. Every new feature goes through the same gauntlet.
The cost
Let’s be honest about the investment:
- Setup time: Half a day building the loop, test infrastructure, and prompts
- Running cost: API tokens for ~40 autonomous sessions
- Human review: About 2 hours reviewing changes and running manual tests
- Total time: Roughly 4 hours of human attention spread over two days
For a 65% improvement in scroll performance and 81% improvement in layout shift, that’s a reasonable trade.
When this approach works
This loop-based optimization works well when:
- You have measurable metrics (not just “make it faster”)
- Changes are low-risk (optimization, not architecture)
- You have automated tests to catch regressions
- The codebase is large enough that human review would take weeks
It works less well when:
- The problem is architectural (you need thinking, not iteration)
- Changes are high-risk (database migrations, API contracts)
- You don’t have metrics to validate improvements
Key takeaways
- Measure before you optimize - Without baseline metrics, you’re guessing
- Small changes compound - Don’t expect one silver bullet
- CLS matters more than you think - Users feel layout shift even when they can’t name it
- Sub-250ms feels instant - That’s your target for click response
- Autonomous loops need supervision - Review the changes, run the manual tests
The agent handled the tedious work—analyzing components, making changes, running tests, documenting decisions. We provided direction and review. That division of labor feels sustainable.
This wraps up the “Taming the Ralph” series. The loop is running, the metrics are improving, and we’ve learned a lot about working alongside AI coding agents. The key insight: treat them like a capable but literal-minded collaborator. Give clear instructions, verify their work, and let them handle the grind.
Enjoyed this article?
Get notified about new posts and product updates.
Related Posts

Claude's Hidden Superpowers for Busy Founders
Reminders, calendar, memory, document creation - I just discovered Claude can do all this. Here's everything I didn't know after months of use.

Stop Babysitting Your AI Agent
You wanted to build products, not manage robots. The shift from supervising AI to directing it - and why the current workflow is broken.

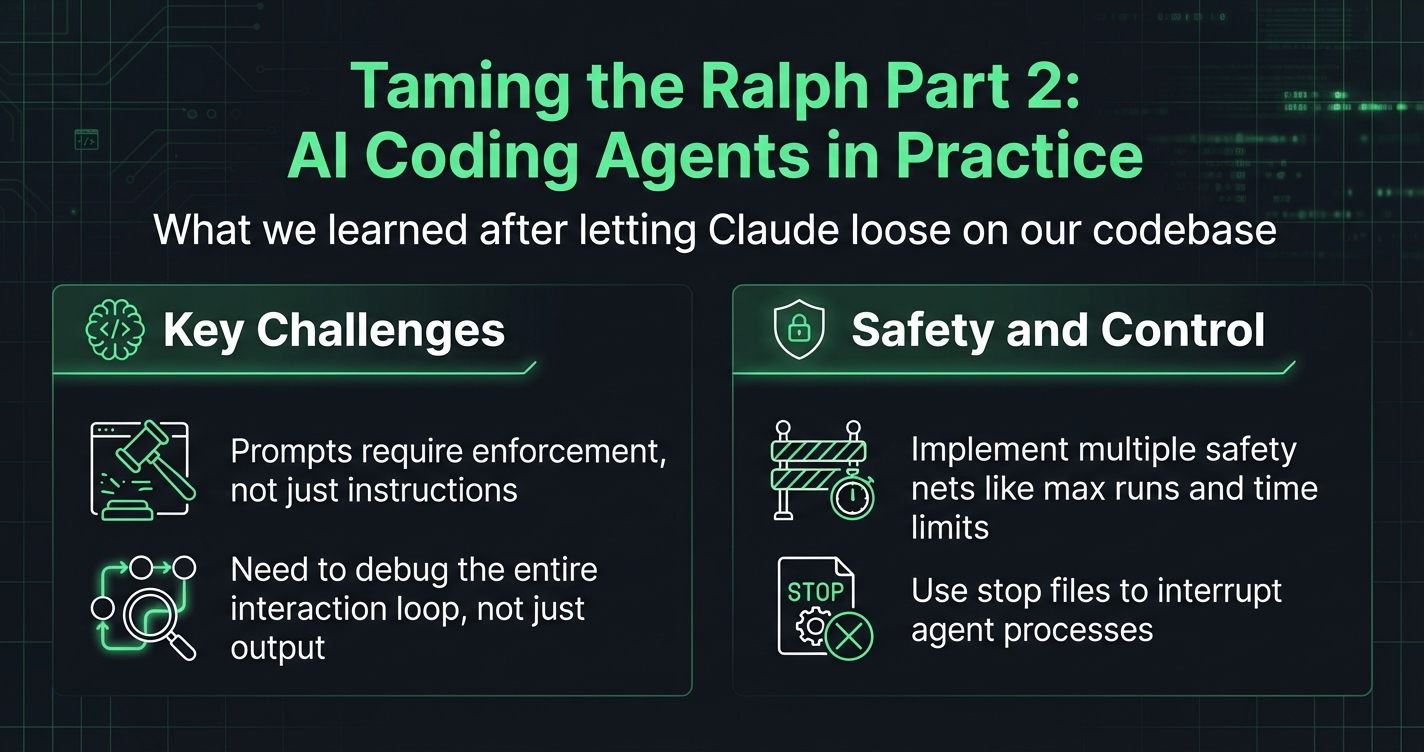
Taming the Ralph Part 2: AI Coding Agents in Practice
What we actually learned after letting Claude loose on our codebase for a day. Loop safety controls, prompt engineering patterns that work, and bridging automated and manual testing.